The North Carolina Education Lottery has seen many changes since its scandal-soaked enactment in 2005: lots of new games, Mega Millions, even a new headquarters. But one thing has remained consistent: the counties with the highest lottery ticket sales per adult also tend to be the state’s poorest and most economically distressed counties.
In a 2007 Spotlight report, Joe Coletti showed that high property taxes, unemployment, and poverty rates are “the best guides to a county’s lottery sales per adult.” In my 2010 Carolina Cronyism report on the lottery, I made the same finding.
I looked into it again for our Agenda 2014 policy booklet and again made the same finding. Ditto for our North Carolina Policy Solutions 2018 booklet:
Counties with high poverty, unemployment, and property tax rates also tend to have high lottery sales per adult. In 2015, the top 10 counties in lottery sales per adult were among the least economically well-off counties in the state. Lottery sales per adult in those counties were nearly two-and-a-half times higher than in the 20 most well-off counties in the state.
I’m revisiting it again for our upcoming policy guide for 2020. The trend is unmistakable.
Here are the numbers for county lottery sales per adult for Fiscal Year 2019:
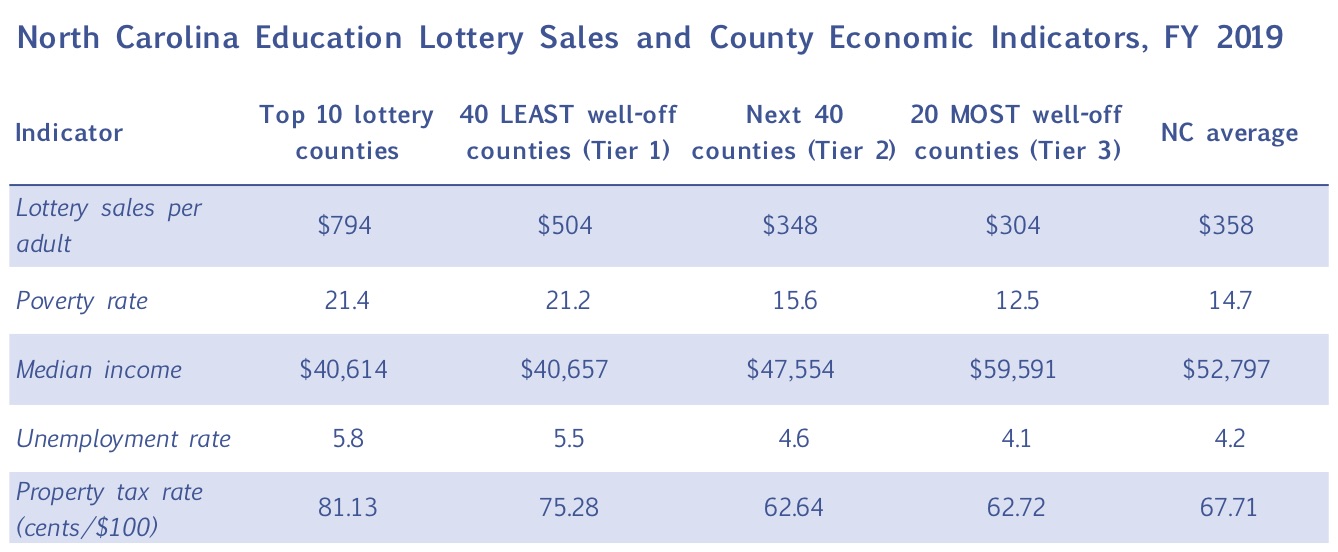
Click the image for a larger size. Data sources (most recent used): NC Education Lottery (Fiscal Year 2019 sales); NC Commerce Department (2019 Tiers); US Census Bureau (adult population 2018, poverty rate 2017, median income 2017); US Bureau of Labor Statistics (unemployment July 2019); NC Department of Revenue (property taxes 2018-19).
Lottery officials caution that county sales may be affected by commuting, tourism, proximity to interstates, etc. It is likely true that some poor counties would, therefore, have disproportionate sales from non-residents. But that could not be enough to explain away these consistent findings.
But with that in mind, this year I also sorted the counties according to different ranges of poverty rates, unemployment rates, property taxes, and median household incomes. Did I still see higher lottery sales per adult in counties with worse measures of economic distress?
Again, consistently, yes.
Here are those results:
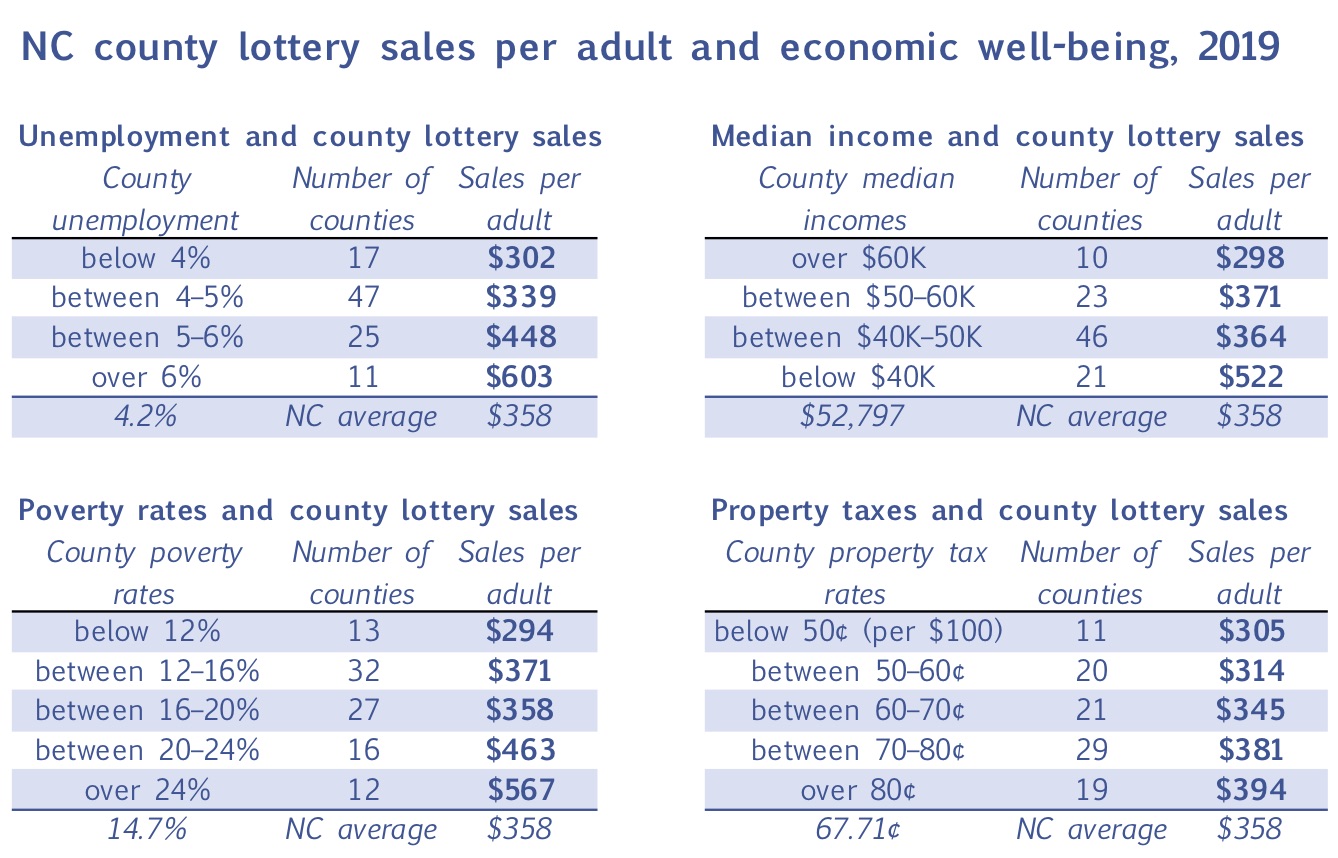
Click the image for a larger size. Data sources (most recent used): NC Education Lottery (Fiscal Year 2019 sales); NC Commerce Department (2019 Tiers); US Census Bureau (adult population 2018, poverty rate 2017, median income 2017); US Bureau of Labor Statistics (unemployment July 2019); NC Department of Revenue (property taxes 2018-19).
A decade and a half in, lottery sales still depend on economic desperation.